Conversion Rate Optimization: A Practical Strategy for Small Businesses
Most social media managers measure reach. The smartest ones measure conversion. The math is blunt: a business spending $3,000 a month on paid traffic and converting at 3% gets 60 leads from 2,000 visitors, lift that to 6%, and the same budget produces 120. The same logic applies to every link you push from a social feed. Social media conversion rate optimization isn’t a one-time website fix. It’s the discipline of finding why visitors aren’t taking action and systematically removing the friction.
Why It Matters
Social media managers ship traffic. A TikTok bio tap, an Instagram Story sticker, a LinkedIn carousel CTA, a Pinterest pin to a landing page, the job ends with a click. But the campaign’s value is decided after the click. That’s where most teams lose the math.
Better creative earns you more clicks. Better conversion paths earn you more customers. The gap between those two outcomes is where CRO lives, and it’s usually wider than teams want to admit. Most social media reports show impressions, reach, and engagement. They rarely show the cost of a wasted click, which is the number that actually decides whether a campaign pays.
The catch is mobile. 61% of local searches happen on mobile, and mobile conversion rates run 40 to 51% lower than desktop on average. Social traffic is almost entirely mobile, DataReportal pegs mobile share of social usage above 99% on most platforms. If your landing pages were built for desktop, you’re hemorrhaging conversions on the exact channel that drives most of your clicks.
The campaign’s value isn’t decided at the click, it’s decided at the conversion. CRO is how you close that gap.
What’s New / How It Works
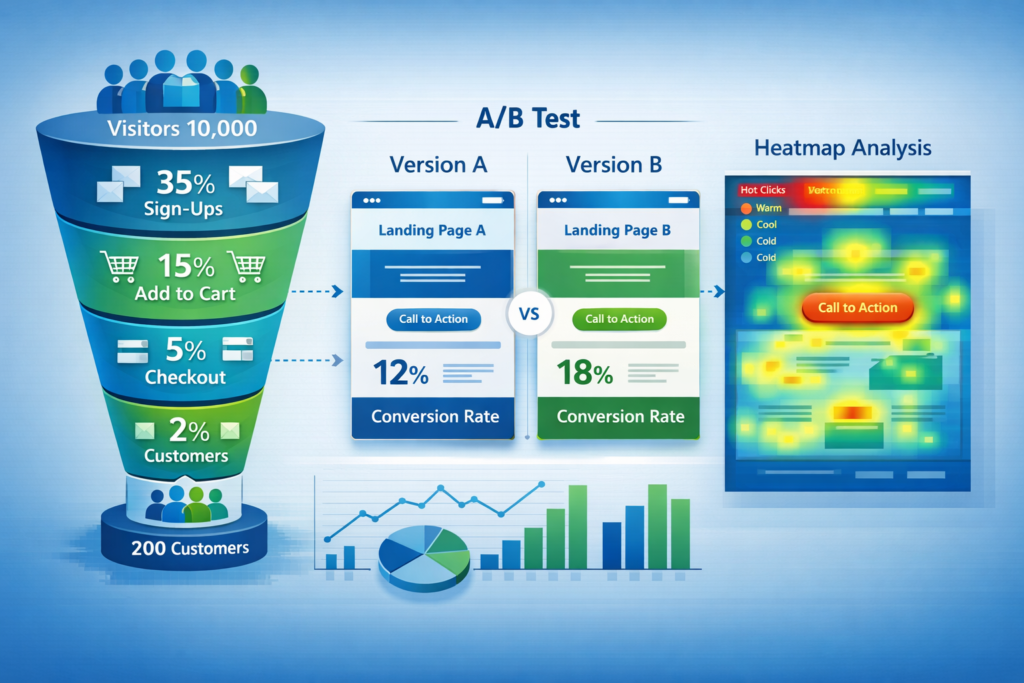
CRO isn’t a single fix. It’s a loop: measure, identify friction, test a change, measure again. For social media managers, four data sources tell you where the leaks are.
Conversion tracking. Set up event tracking in Google Analytics 4 for the actions that matter: phone calls (via CallRail or similar), form submissions, demo bookings, link-in-bio taps, app installs. If you can’t see which post or landing page produced the conversion, you can’t prioritize what to fix.
Heatmaps and session recordings. Tools like Microsoft Clarity (free) and Hotjar show exactly where visitors click, how far they scroll, and where they drop off. This data reveals problems no dashboard will surface, visitors clicking an image thinking it’s a button, mobile users abandoning before they reach the CTA, phone numbers that aren’t tappable.
Exit-rate analysis. Sort your landing pages by exit rate. Pages where a high percentage of visitors leave without converting are your biggest opportunity pages. The traffic is showing up, something on the page is breaking the journey.
Ad-to-page match. If your TikTok caption promises “free trial” and the landing page leads with “Welcome to Acme Inc.,” visitors feel misled and bounce. The offer in the post and the offer on the page should match word-for-word. This is the most common cause of high bounce rates on paid traffic.
The Numbers
The benchmark stats every social media manager should hold in their head:
- 20%, average form completion rate; longer forms (5+ fields) perform measurably worse
- 40-51%, how much lower mobile conversion rates run compared to desktop
- 61%, share of local searches that happen on mobile
- 80%, share of visitors who read only the headline before deciding whether to stay
- 3 seconds, the load-time ceiling on cellular; slower pages bleed conversions linearly
- 33%, the compounded lift from three sequential 10% improvements
“CRO without data is guessing with a better name.”
What Comes Next
The independent A/B testing tool landscape has consolidated. Google Optimize was discontinued in 2023. The current options are Optimizely, VWO, and AB Tasty for enterprise testing; for WordPress-based landing pages, Nelio A/B Testing integrates cleanly without engineering work.
For social media managers, the highest-leverage tests aren’t exotic. They’re the obvious elements you’ve been ignoring:
- Headline, 80% of visitors read only this. Test against your current control for 2-4 weeks.
- CTA button copy, “Get a Free Quote” vs. “Request Your Free Estimate” can swing conversion 10-15%.
- Form length, cut fields one at a time; measure what each removal does to completion rate.
- Testimonial placement, above the fold vs. below; near the CTA vs. in the footer.
- Page speed, image compression and lazy loading produce measurable mobile lifts.
The compounding math matters more than any single test. Three modest 10% improvements stack to a 33% overall lift, which on a paid social budget of $5,000 a month means meaningfully more leads at the same spend.
What This Means for You
If you manage social for a brand, the CRO playbook adapts in three ways:
Treat your link-in-bio like a landing page. Most teams treat it as a link list. It’s the highest-converting real estate in your entire social footprint, every TikTok and Instagram tap routes through it. Run the same headline test, CTA test, and mobile audit you’d run on a paid landing page. A Feedsta link-in-bio page gives you tap analytics on each destination so you actually see where attention is leaking.
Match your post creative to your landing-page headline. The Instagram caption, the TikTok hook, and the landing-page hero should use the same words. We covered this in depth in Social Media Landing Pages: The Conversion Math You’re Missing, if you’re running paid social to a page that doesn’t restate the offer, fix that before testing anything else.
Audit conversion path on an actual phone, not a desktop emulator. Open your link-in-bio, your latest Feedsta landing page, and your contact form on a real iPhone. Can you read the headline without zooming? Is the phone number tappable? Is the form usable with one thumb? Most teams have never done this audit. The ones who have find five fixable problems on every page.
And measure all of it. Engagement metrics tell you whether posts perform; conversion metrics tell you whether the business performs. The Feedsta analytics dashboard ties posts to clicks to conversions so you stop optimizing in the dark. For the broader question of whether AI-generated posts actually drive the same conversion behavior as human-written ones, see AI Content vs. Human Content: Which One Actually Ranks in 2026?
The Bigger Picture
Social media has always rewarded reach. In 2026, the channels that win, and the managers who keep their budgets, are the ones who translate reach into action. CRO is the discipline that bridges the gap. It’s unglamorous, it’s data-heavy, and it compounds. Most social teams have never run a single A/B test on their link-in-bio or landing pages. That’s not a problem. That’s an opportunity hiding in plain sight, and the math says the team that runs the first three tests this quarter will out-convert the team that ships ten more posts.